
What Is SJR? SCImago Journal Rank Explained (and How to Judge a Journal)
SJR is a journal score that weights citations by source, not just count. If two journals get the same number of citations, the one cited by stronger journals can rank higher. SCImago reports data for 34,100+ titles across 27 subject areas, so SJR is a useful first screen when I want to judge a journal fast.
If I need the short version, here it is:
- SJR measures influence, not raw citation volume
- Q1–Q4 only matter inside one subject category
- Rank, percentile, and multi-year trend matter more than one score alone
- A score around 1.0 is only a rough reference point
- SJR helps screen journals, but it does not judge one paper by itself
When I check a journal, I keep it simple:
- Match the scope to my topic
- Check the quartile in the right category
- Look at the SJR score without overreading tiny gaps
- Review the trend over time
- Confirm the journal is legitimate and has a publishing track record
Here’s the main point: SJR is useful for reading, citing, and submitting - but only as a starting filter. A Q1 journal is often strong in its field, but that does not mean every article is strong. And a Q3 or Q4 journal can still publish a paper worth using.
Quick comparison
| What to check | What it tells me | What to avoid |
|---|---|---|
| SJR score | Weighted citation influence | Treating it like a universal grade |
| Quartile (Q1–Q4) | Position in a subject category | Comparing quartiles across different fields |
| Rank / percentile | More exact place in the category | Looking only at quartile labels |
| Trend chart | Whether the journal is steady or slipping | Judging from one year only |
| Journal scope | Fit for my topic | Assuming high rank means good fit |
So if I want to judge a journal well, I use SJR + field category + trend + scope, then I look at the journal and the paper itself.
What SJR Is and How It Works
What SJR Actually Measures
SJR measures a journal’s influence within its field, not just how many citations it gets. The key idea is simple: not all citations carry the same weight.
A citation from a highly ranked journal counts for more than a citation from a lower-ranked one. So the score looks at the quality of attention a journal gets, not only the raw total.
That’s why the scoring method matters.
The Logic Behind the Calculation
SJR uses a PageRank-style model. Influence moves through citations, so journals cited by influential journals get more weight in return.
It uses Scopus citation data from a rolling three-year window and puts more weight on citations from closely related fields.
Then that weighted total gets divided by the number of citable documents published in the same period. In plain English, a bigger journal doesn’t get an automatic edge just because it publishes more papers.
Once you see how the score is built, it becomes much easier to read it the right way.
Why the Score Is Only Meaningful in Context
A score of 1.0 can work as a rough baseline, but it’s not a universal standard. SJR makes the most sense when you compare journals inside the same subject category.
Small differences in score often come from normal citation swings, not from a clear gap in prestige.
What is SCImago Journal Rank (SJR) and How is it Calculated [English]
How to Read SJR Rankings in SCImago
Once you understand how SJR works, the next step is figuring out where a journal stands in SCImago.
How to Interpret Quartiles Q1 Through Q4
When you open a journal profile in SCImago, each journal in a subject category is ranked by SJR score and placed into one of four quartiles:
| Quartile | Position in Category | What It Signals |
|---|---|---|
| Q1 | Top 25% | Top-ranked journals in that field |
| Q2 | 25%–50% | Above-average prestige |
| Q3 | 50%–75% | Below-average prestige |
| Q4 | Bottom 25% | Lowest-prestige journals in that field |
Here's where people often get tripped up: Q1 is only meaningful inside its own field. Citation patterns differ a lot by discipline, so a Q1 journal in Nursing is not directly comparable to a Q1 journal in Physics. Quartiles work within a single subject category, not across different fields.
There's another wrinkle. A journal can appear in more than one subject category, and its quartile can change from one category to another. For example, a journal might be Q1 in Public Health but Q2 in Epidemiology. So if you're judging a journal for your own work, check the quartile tied to your exact research area - not just the best rank shown on the profile.
How to Use Subject Category Rank and Percentile
Quartiles give you a quick snapshot, but rank and percentile tell you more. The numerical rank shows a journal's exact place in its category, which is more precise than a broad quartile band.
SCImago also shows percentile, which places the journal on a 0–100 scale within that category. That makes it easier to see whether a journal is barely in Q1 or sitting near the very top.
How to Check a Journal's Trend Over Time
A single year doesn't tell the whole story. Annual updates can shift a journal's quartile when new Scopus data are added.
"Annual data updating can modify journal's quartile from other years." - SCImago
SCImago profiles also include time-series charts going back to 1999. That lets you see whether a journal has stayed in Q1 for years or only moved there recently. A multi-year Q1 or Q2 pattern usually says more than a one-year jump.
When you're deciding whether to read, cite, or submit to a journal, it helps to look at quartile, rank, and trend together.
sbb-itb-f7d34da
How to Use SJR to Decide Whether to Read, Cite, or Submit to a Journal
How to Evaluate a Journal Using SJR: 5-Step Process
Knowing what SJR measures is one thing. Using it to make an actual decision is another. The goal is simple: use the journal profile to decide whether it's worth reading, citing, or submitting to.
A Step-by-Step Journal Evaluation Process
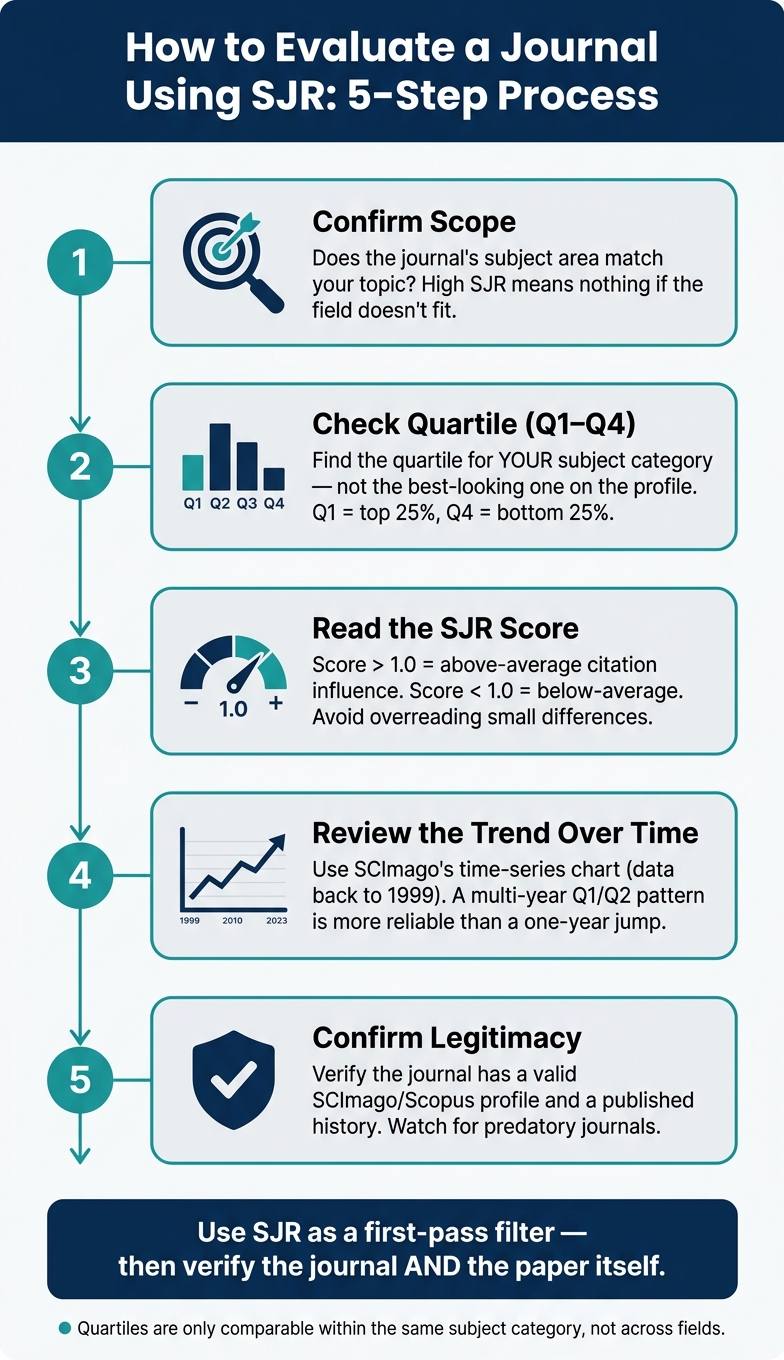
Start at scimagojr.com and search for the journal by title or ISSN. Once you land on the journal profile, go through these five checks in order:
- Confirm scope: Does the journal's subject area line up with your topic? Even a high SJR doesn't help if the journal doesn't publish work in your field.
- Check quartile: Look at the quartile for the subject category closest to your research, not the one that makes the journal look best on the page.
- Read the SJR score: A score above 1.0 points to stronger-than-average citation influence in that field. A score below 1.0 points to weaker influence, but not poor quality.
- Review the trend: Use the time-series chart to see whether the journal's standing has stayed steady or slipped over time.
- Check basic legitimacy: Make sure the journal has a valid SCImago/Scopus profile and a published history.
This process keeps you from making snap calls based on one number. A journal can look strong at first glance and still be a poor fit for your topic.
What SJR Tells You for Reading, Citing, and Submitting
The way you use SJR should change based on your goal.
When reading, treat Q1 or Q2 as a quick filter. It helps you sort papers fast. But a paper from a Q3 or Q4 journal isn't automatic junk. It just means you should look harder at the method before you lean on the findings.
When citing, don't get obsessed with the highest SJR on the list. A journal may sit in Q2 overall and still matter a lot in your subfield. Use SJR to check that the source has a place in your area, then decide whether the paper does the job you need it to do.
When submitting, line up your manuscript's scope and audience with the journal's quartile. Q1 or Q2 often makes sense for high-impact work. Q3 or Q4 can make more sense for niche topics or early-stage findings. And before you hit submit, look at the trend chart. If the journal has been sliding for years, slow down and take a closer look.
"A journal with a SJR value > 1.0 has above average citation potential and journal with a SJR value < 1.0 has below average citation potential." - Kalamazoo College
Using Sourcely to Find Sources and Check Journal Quality

Once you know how to judge a journal, Sourcely can help you build the list of papers to inspect. Use Sourcely to find papers tied to your topic, then check each journal in SCImago before you decide to read it, cite it, or send your own work there.
SJR's Limits and How to Use It Well
SJR is useful, but it works best as a first-pass filter, not a final call.
Where SJR Outperforms Raw Citation Counts
Compared with raw counts, SJR discounts low-prestige citations and gives a better sense of journal influence. In plain English, not every citation counts the same. A citation from a highly influential journal carries more weight than one from a lower-prestige source. Its three-year window can also be steadier than JIF's two-year window.
| Feature | Raw Citation Count / Impact Factor | Prestige-Weighted SJR |
|---|---|---|
| What it signals | Popularity and total citation volume | Citation prestige and weighted influence |
| Time window | Typically 2 years (for JIF) | 3 years |
SJR also puts guardrails on manipulation. No single citation can transfer more than 10% of a citing journal's total prestige, and a journal cannot pass on more than 50% of its total prestige through outbound citations. That makes self-citation rings a lot less effective.
Still, that strength only goes so far. SJR works at the journal level, not the article level.
Where SJR Can Give You a Misleading Picture
This is the big catch: SJR measures journal averages, not the quality of any one paper. A Q1 journal can publish weak work. A Q3 journal can publish a paper that changes the field.
New journals also start at a disadvantage because they don't have much citation history yet. And review-heavy journals often score higher, since review articles tend to attract more citations.
Scopus coverage is strongest in the natural sciences, engineering, and medicine. That can skew rankings in the humanities, social sciences, and some fields that sit between disciplines.
Conclusion: Use SJR as a Starting Screen, Not a Final Verdict
SJR is a solid first filter. Quartiles and subject-category rankings usually tell you more than the raw score by itself, and a journal's direction over time can say more than one year's number. But the metric stops at the journal level.
So use SJR to narrow your list. Then check the journal's scope, editorial transparency, indexing, and the paper itself. For open-access journals, DOAJ is another useful signal.
Use SJR to trim the list, then verify both the journal and the article before making a decision.
FAQs
Is SJR better than Impact Factor?
It depends on what you're trying to judge.
Impact Factor looks at the average number of citations a journal gets over a two-year period. SJR, on the other hand, uses a prestige-weighted approach. That means a citation from a highly respected, closely related journal counts more than one from a less influential source.
SJR also includes more journals through Scopus, is free to access, and uses Q1–Q4 quartiles, which makes it easier to read at a glance.
That said, both are journal-level metrics. They can help inform a decision, but they shouldn't take the place of peer review.
Why can a journal have different quartiles?
A journal can have different quartiles because rankings are category-specific. Many journals sit across more than one subject area, so they’re compared with different groups of journals in each category.
That means the same journal might be Q1 in one field and Q2 in another. It’s the same publication, just judged within different subject groupings.
Quartiles can also shift from year to year as citation data gets updated. So when you check a journal’s quartile, look at the subject category that best matches your research.
Can I trust a Q3 or Q4 journal?
Yes. Q3 and Q4 journals can still publish high-quality, relevant, and even foundational research. A journal’s quartile tells you about its average citation impact, not the quality of every single paper inside it.
Use quartiles as a quick way to gauge a journal’s general standing within its subject category. Q1 sits in the top 25%, while Q4 falls in the bottom 25%.
That said, a Q3 or Q4 label shouldn’t be the end of the story. When you’re looking at a paper from one of those journals, pay closer attention to the study’s methodology and its relevance to your topic.